🔸 Introduction
Candlestick patterns are one of the most important tools in technical analysis.
They help traders understand price action, market psychology, and possible trend reversals.
कैंडलस्टिक पैटर्न ट्रेडिंग में प्राइस मूवमेंट को समझने का सबसे आसान तरीका है।
🔹 What is a Candlestick Pattern?
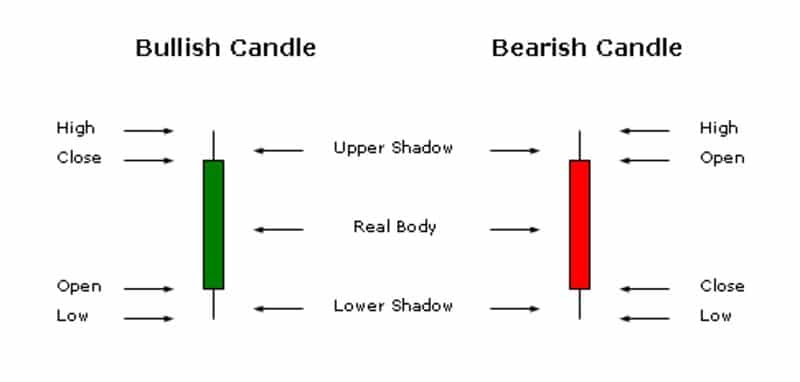
A candlestick pattern is formed by one or more candles on a price chart. Each candle represents Open, High, Low, and Close (OHLC).
हर कैंडल यह दिखाती है:
Open – शुरुआत
Close – बंद भाव
High – ऊँचाई
Low – निचला स्तर
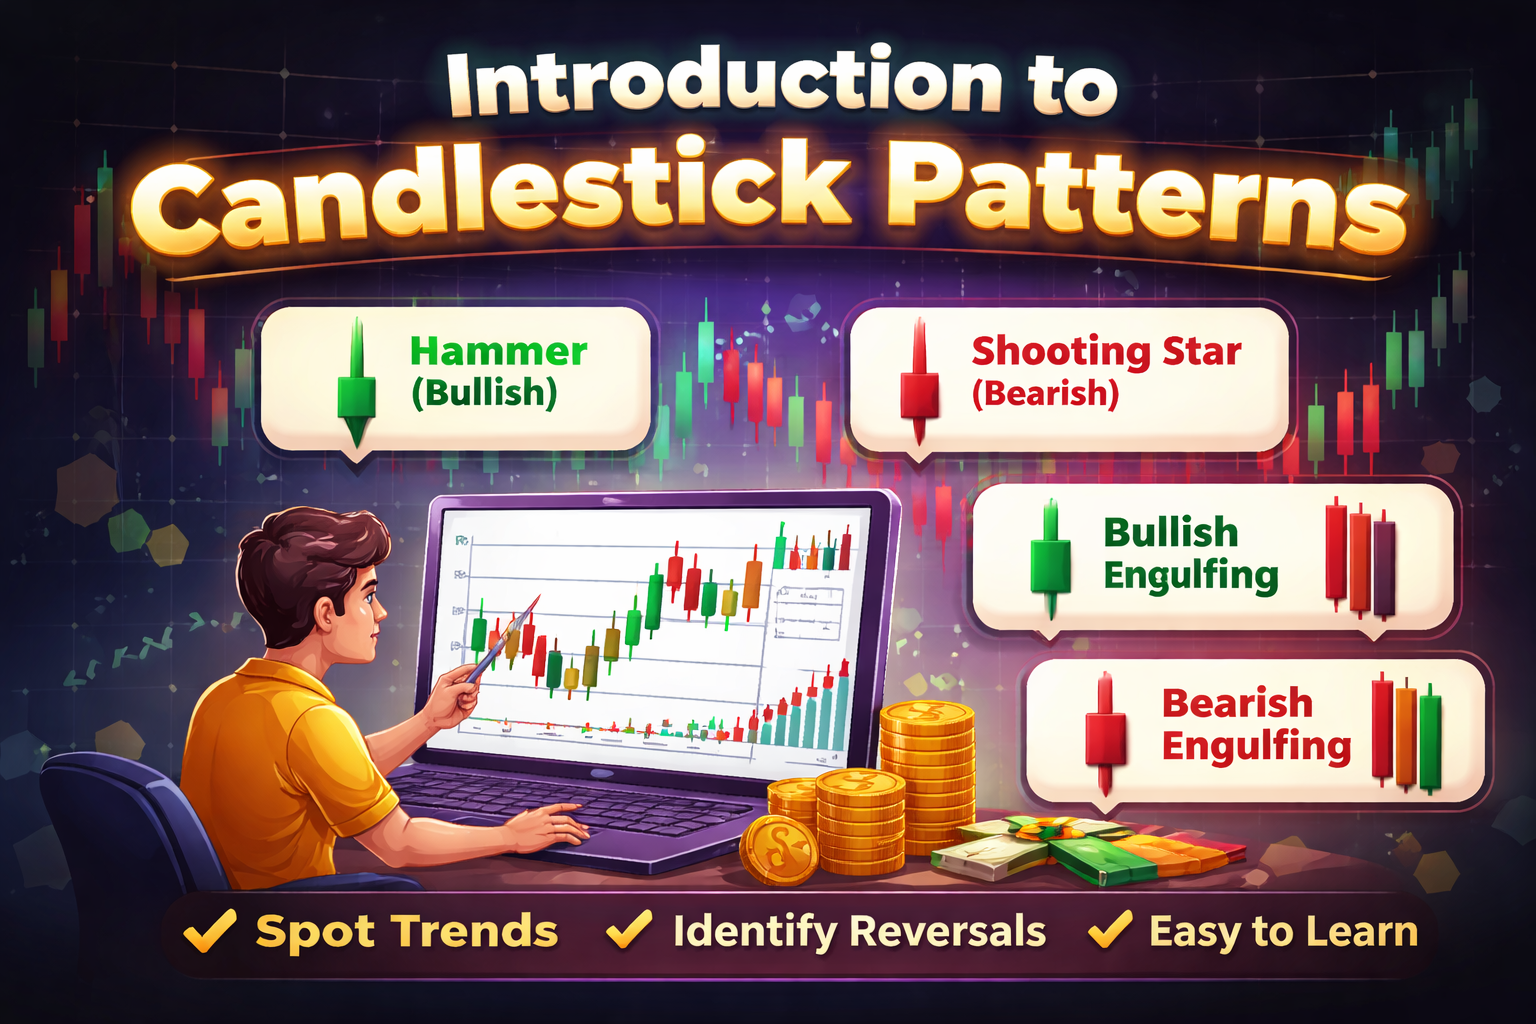
🔥 Top Candlestick Patterns Every Trader Must Know
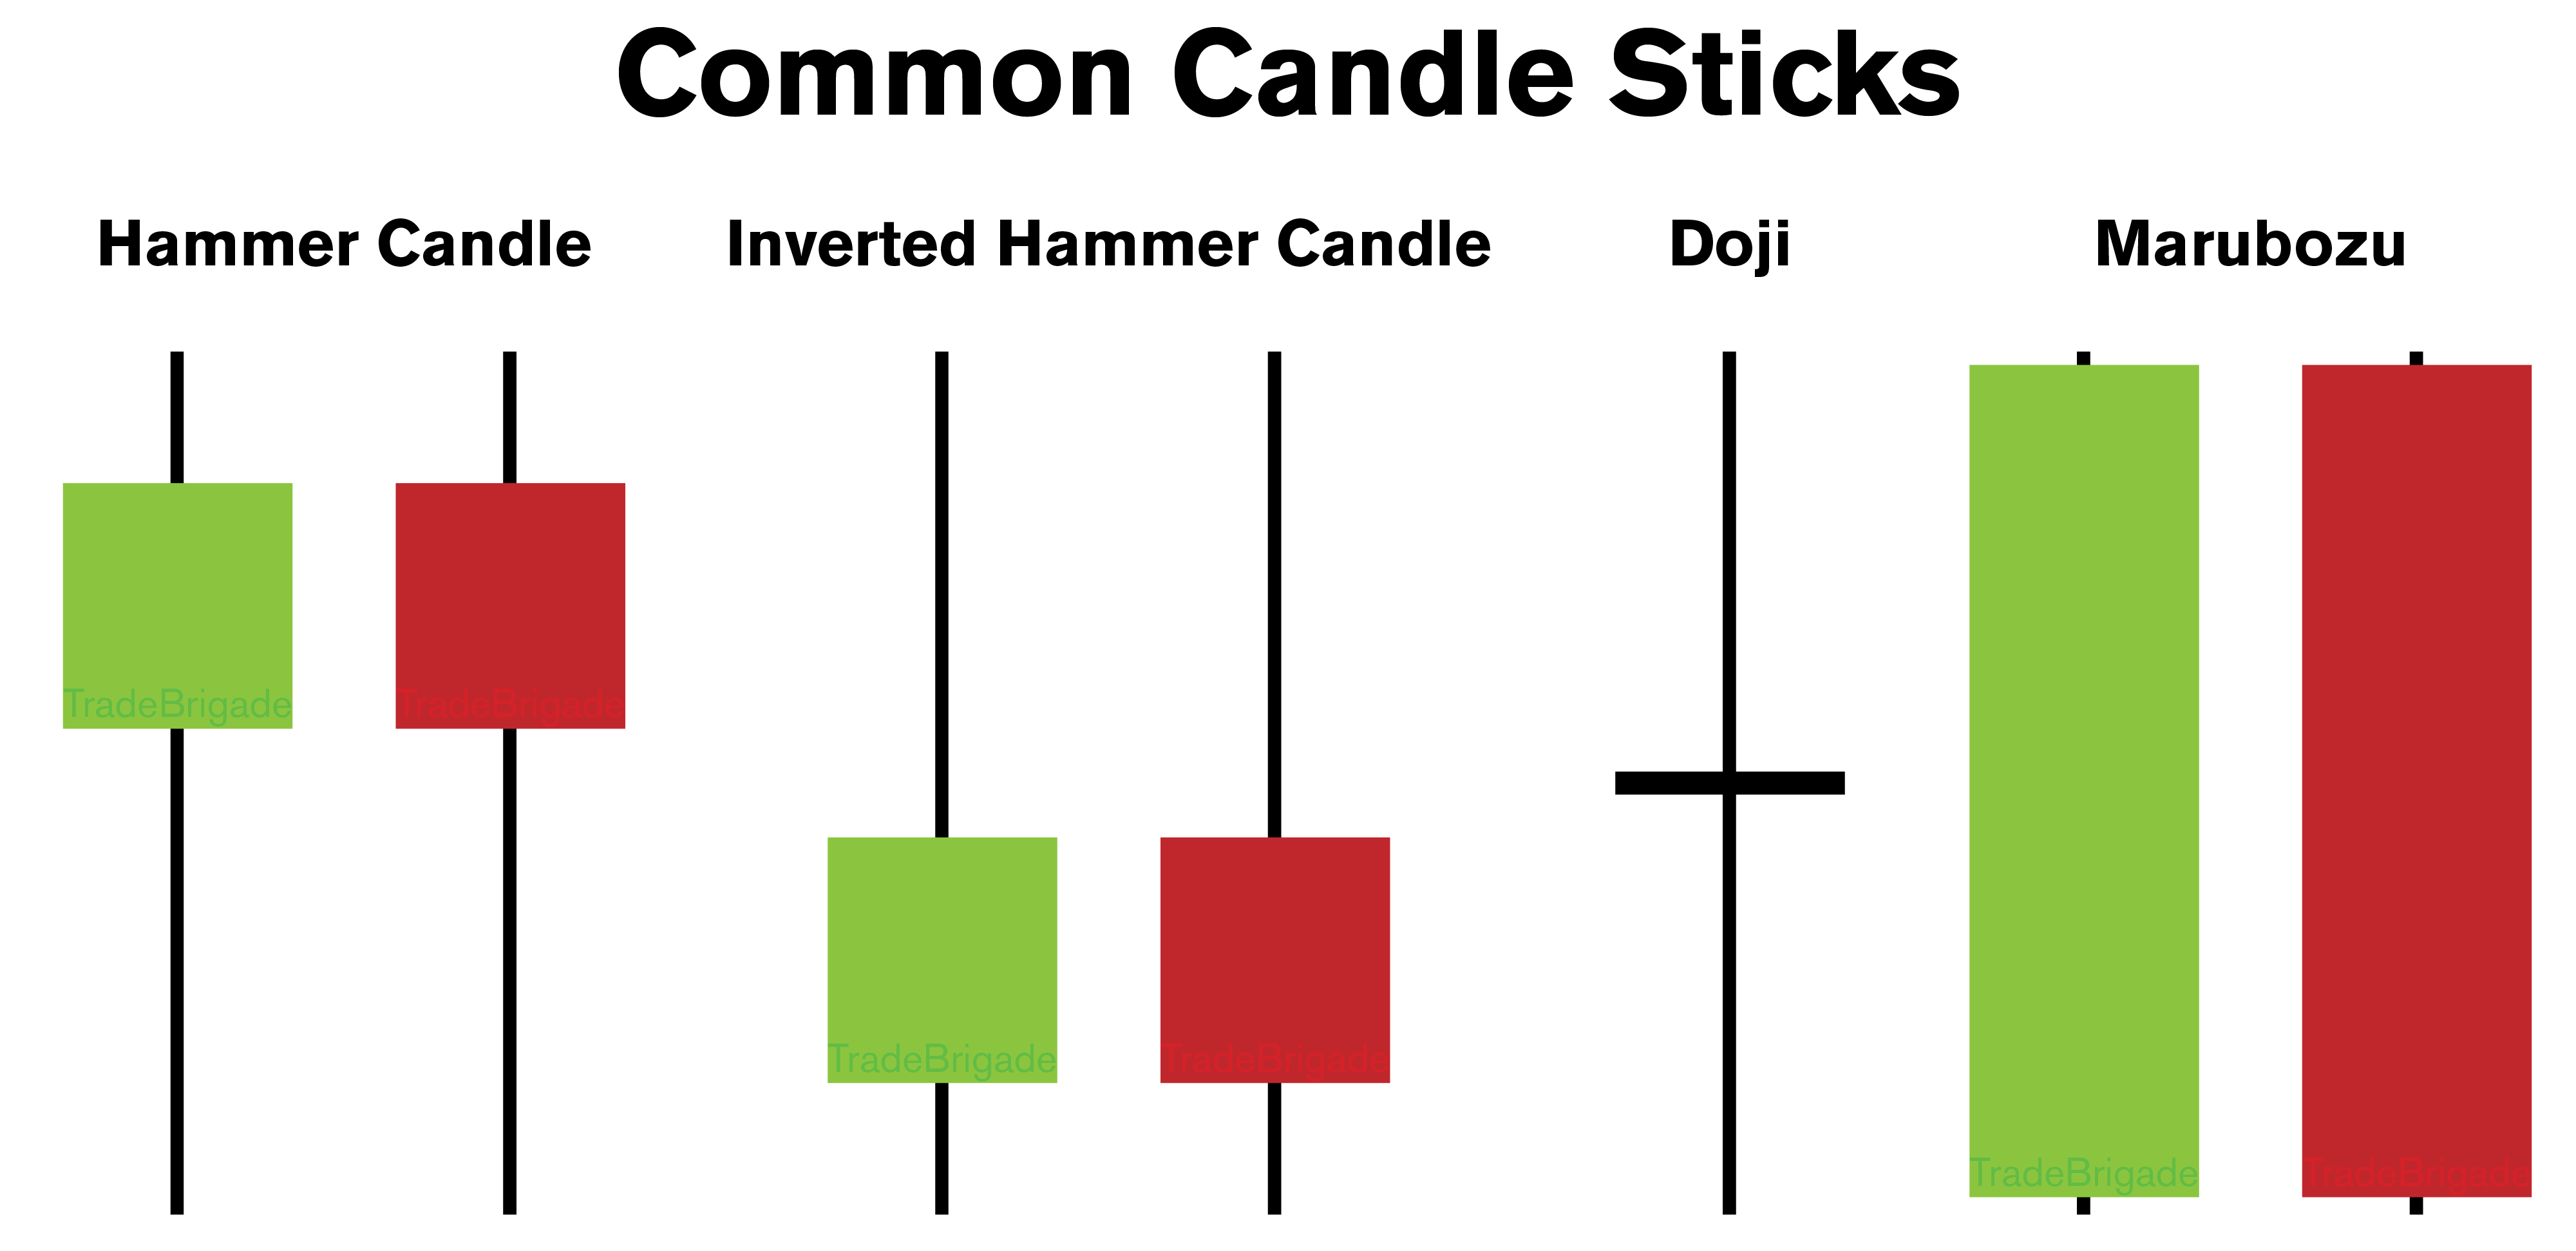
1️⃣ Hammer (Bullish Reversal)
- Appears after downtrend
- Long lower wick
- Small body at top
Hindi:
👉 Hammer कैंडल यह दिखाती है कि नीचे से खरीदारी आ रही है।

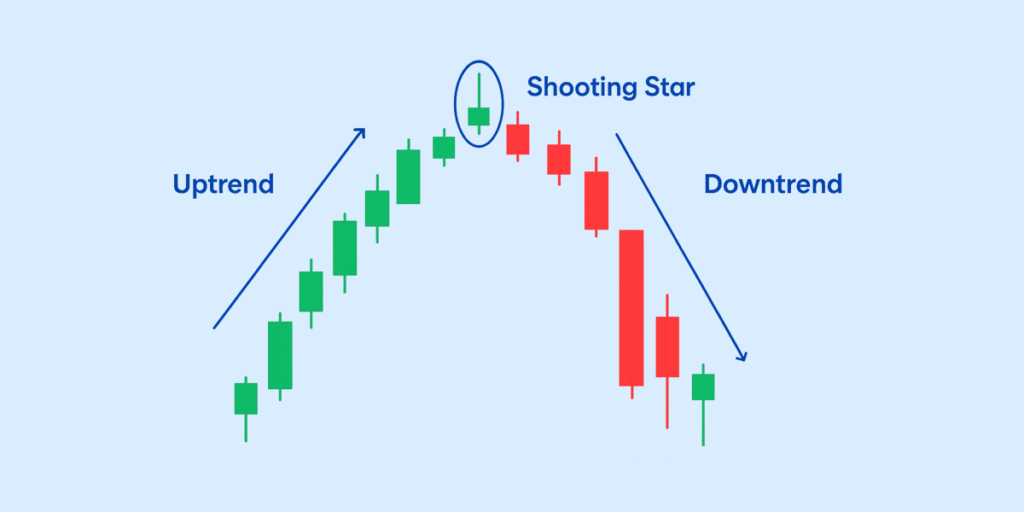
2️⃣ Shooting Star (Bearish Reversal)
- Appears after uptrend
- Long upper wick
- Weak buyers
Hindi:
👉 Shooting Star यह संकेत देती है कि ऊपर से बिकवाली शुरू हो सकती है।
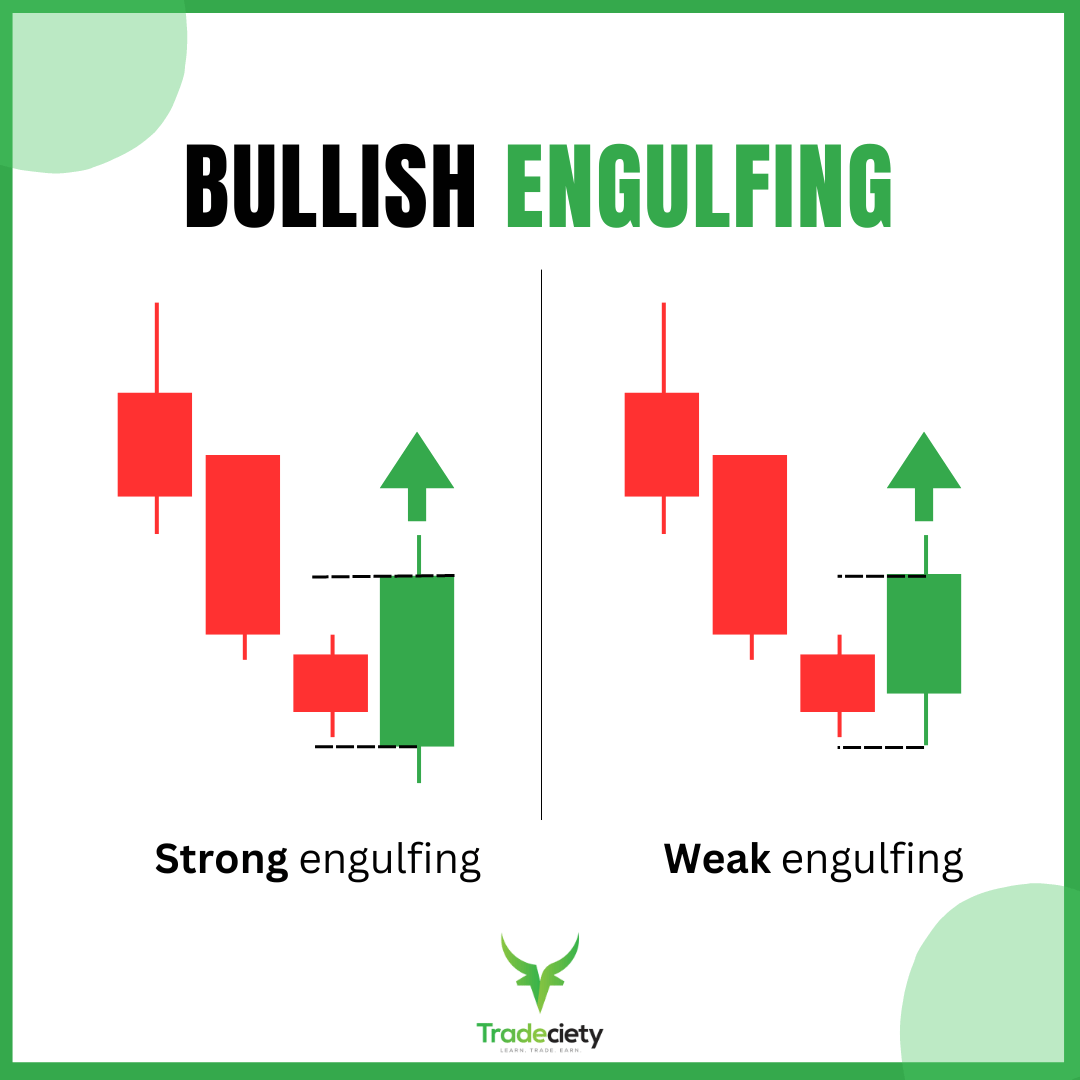
3️⃣ Bullish Engulfing
- Big green candle covers previous red candle
- Strong buying pressure
Hindi:
👉 Bullish Engulfing यह दिखाता है कि buyers market का control ले चुके हैं।

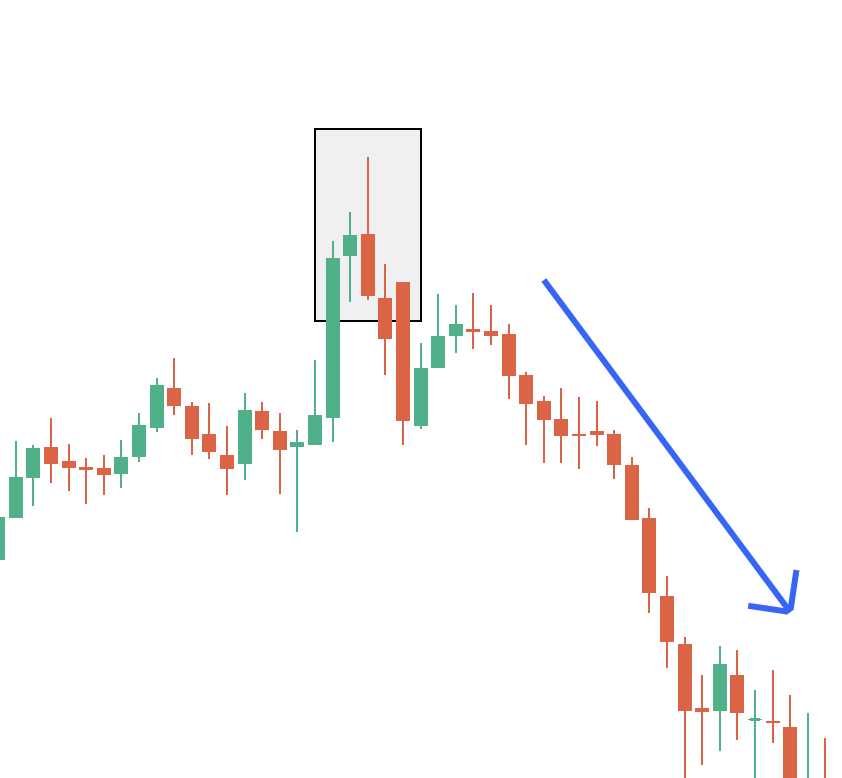
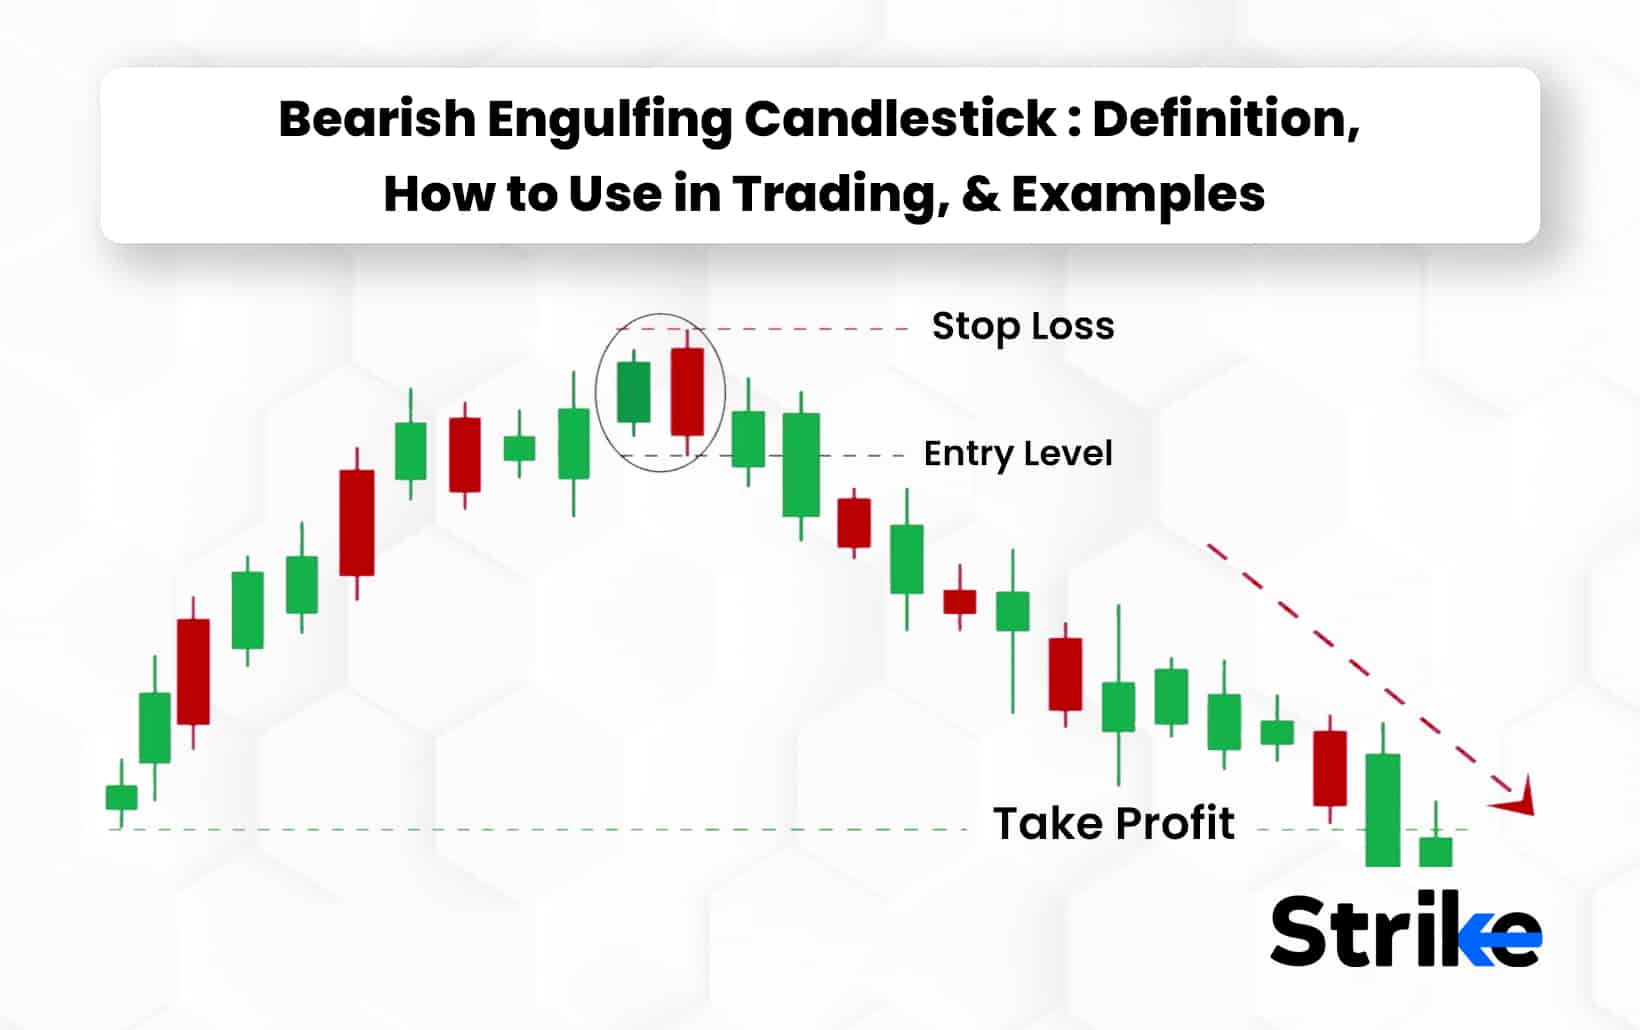
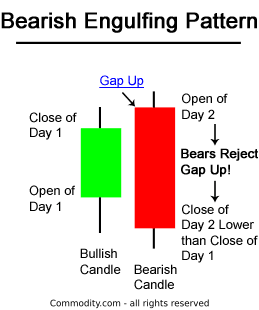
4️⃣ Bearish Engulfing
- Big red candle covers previous green candle
- Selling pressure increases
Hindi:
👉 Bearish Engulfing यह बताता है कि sellers market पर हावी हो रहे हैं।
📌 Trading Tips (Important)
- ✔ Always confirm candlestick pattern with trend
- ✔ Use support and resistance levels
- ✔ Check volume for confirmation
- ✔ Always use stop loss
⚠️ Common Mistakes Traders Make
- ❌ Trading every candle
- ❌ Ignoring market trend
- ❌ No risk management
Long-term investors can use our SIP Calculator to estimate wealth creation, while salaried employees can check savings using the PF Calculator.
📊 Final Words
Candlestick patterns are powerful when used with discipline and confirmation. Do not rely on a single candle — combine patterns with proper risk management.
अगर आप नए trader हैं, तो पहले practice करें और फिर real money से trade करें।